Devpost
Participate in our public hackathons
Devpost for Teams
Access your company's private hackathons
Grow your developer ecosystem and promote your platform
Drive innovation, collaboration, and retention within your organization
By use case
Blog
Insights into hackathon planning and participation
Customer stories
Inspiration from peers and other industry leaders
Planning guides
Best practices for planning online and in-person hackathons
Webinars & events
Upcoming events and on-demand recordings
Help desk
Common questions and support documentation
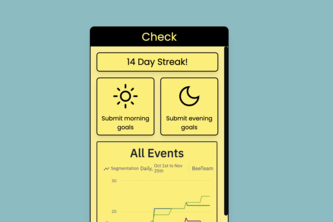
A tool that aggregates user supplied data to infer behaviours, track habits, improve goal achievability and mental wellbeing.
Show content that is meaningful to the customers based on their interaction
Data visualization using AI-generated images.Demonstrated using dog activity data.
Data without context is noise. Tell your story Masurian Analysis Enrichment.
It's a bit of a pain uploading data from a CSV into Amplitude. This tool makes it a bit easier.
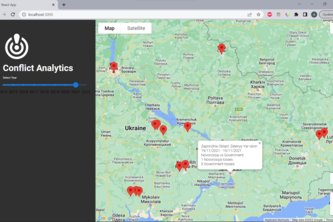
A visual tool representing the development of the Ukraine conflict, showing areas of interest since 2014 when Crimea was annexed by Russia. Sentiment analysis is used to predict future development.
Microsoft Office is a popular software suite that many of us have grown up with. Despite this, Amplitude does not list Microsoft Office in their Sources/Destinations. This project changes that.
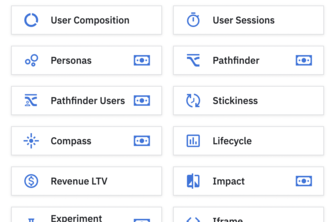
Embed a third party website in an Amplitude Dashboard!
Putting values at the heart of hiring.
1 – 9 of 9